Assignment 2
Overview
Due date: 07/15/25 at 11:59pm
This week we introduced the Tidyverse collection of R packages. The packages covered are commonly used in biomedical research data analysis. These packages are well-documented online by their creators and user communities. If you have a question about any of the packages, googling will likely give you a solution from a forum of someone else having the same question or issue.
In this week’s Swirl lessons, you’ll explore one of the core Tidyverse packages: ggplot2. This powerful package makes it easy to transform tidydata into informative visualizations while allowing easy plot management and customization.
Through the lessons for this week, you will learn the following:
- Using base methods to produce plots
- Customizing plots
- The basics of GGPlot2 and a little more
Swirl Course Setup
In RStudio, load in the swirl package
library("swirl")Navigate to this link. Download the Swirl lesson file
2_Exploratory_Data_Analysis.swc. Move it into your working directory for the class.Once you have the file in your working directory, in the console of RStudio type the command below and after the
swc_path =type"and then hittabto interactively choose the2_Exploratory_Data_Analysis.swcfile you just downloaded from your working directory. The command will look something likeinstall_course(swc_path = "2_Exploratory_Data_Analysis.swc"). Run the command to install the course.install_course(swc_path = )Start Swirl by typing the following command
swirl()
Working through the Lessons
Please enter your full name together when asked what you want to be called by e.g. JaneDoe
Complete all lessons
- 1: Principles of Analytic Graphs
- 2: Exploratory Graphs
- 3: Graphics Devices in R
- 4: Plotting Systems
- 5: Base Plotting System
- 6: Lattice Plotting System
- 7: Working with Colors
- 8: GGPlot2 Part1
- 9: GGPlot2 Part2
- 10: GGPlot2 Extras
You can take breaks between lessons (like shutting down Swirl and exiting RStudio), just use the same name when logging in for documenting purposes on the instructor’s end.
If you start a lesson, please complete it fully before taking a break. If you stop RStudio in the middle of a lesson, your progress for that lesson may still be saved in the history for that package locally, but will not be saved or sent to us on the instructor’s end.
If you do not get to the Google Form end of any lesson, please email one of the instructors as soon as possible.
Submission
FYI: You need a google account to submit the assignment.
Swirl will navigate you to the submission Google Form of each lesson. However, review the instructions below before submitting to make sure you are able to submit correctly.
When submitting please make sure the box is not empty, if it is please email one of the instructors.
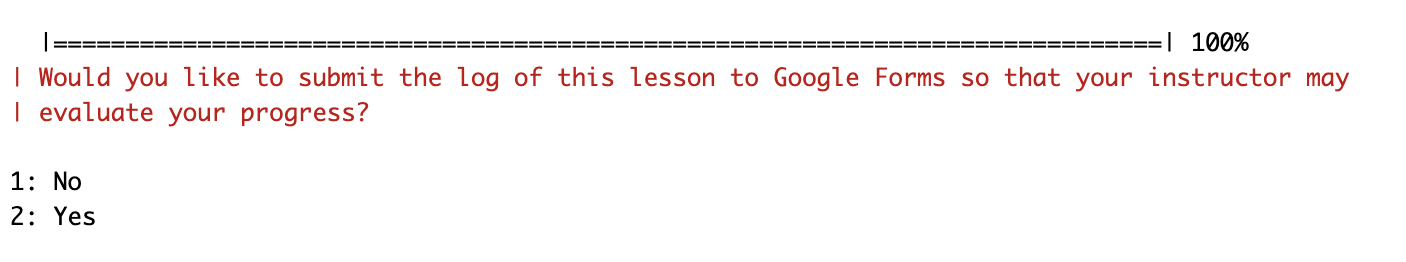
At the end of each lesson the following question will appear, enter the selection Yes to be redirected to your autofilled Google Form submission
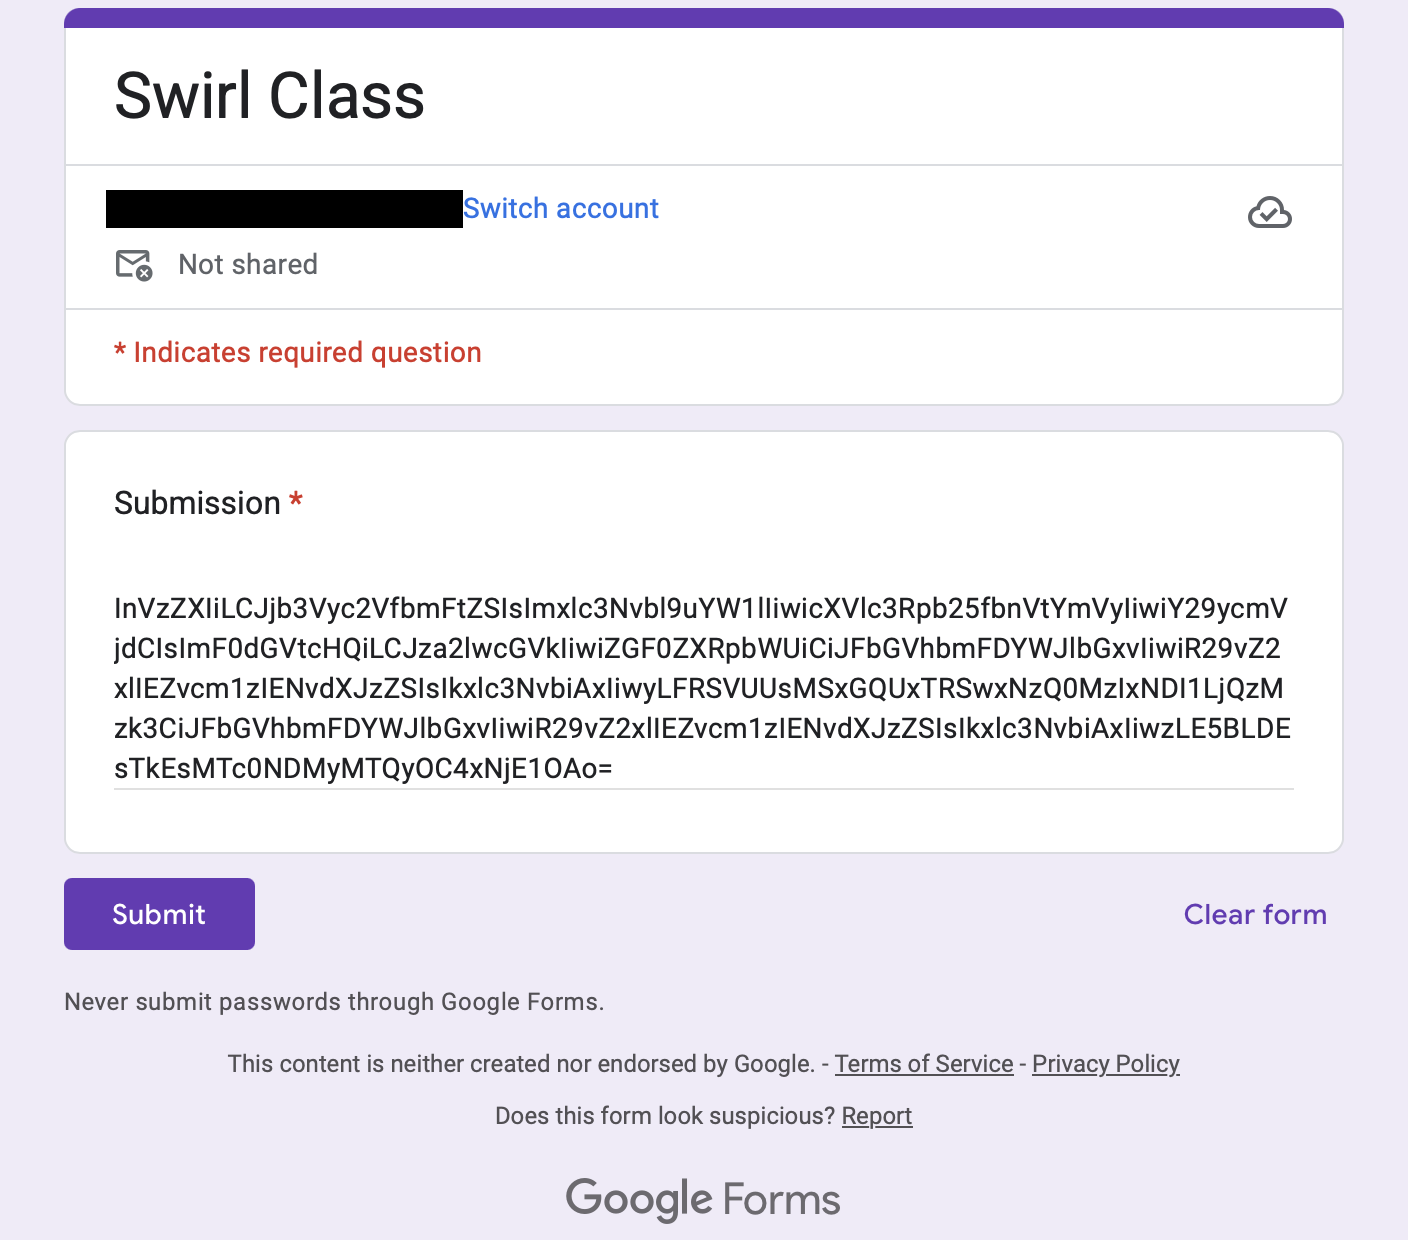
Once you’ve been redirected, your Swirl activity will be autofilled into the submission box, just hit the Submit button
- If you do not get to the Google Form at the end of any lesson, please email one of the instructors as soon as possible.